2. Usage guide
2.1. Invoking dot2tex from the command line
Syntax:
dot2tex [options] [inputfile]
Input data is read from standard input if no input file is specified. Output is written to standard output unless a destination file is set with the -o option.
Dot2tex can also be loaded as a module for use in other Python program. See the section Using dot2tex as a module for more details.
Dot2tex relies on the xdot format generated by Graphviz. Dot2tex will automatically run dot on the input data if it is in the plain dot format. If you want to use other layout tools like neato and circo, use the --prog option. You can pass options to the layout program with the --progoptions option.
A few examples on how to invoke dot2tex:
Read a file from standard input and write the result to the file test.tex:
$ dot -Txdot test.dot | dot2tex > test.tex
$ neato -Txdot -Gstart=rand test.dot | dot2tex > test.tex
Load test.dot, convert it to xdot format and output the resulting graph using the tikz output format to testpgf.tex:
$ dot2tex -ftikz test.dot > testtikz.tex
The same as above, but use neato for graph layout:
$ dot2tex --prog=neato -ftikz test.dot > testtikz.tex
Invoking dot2tex
If you are on Windows and have installed dot2tex from source, you have to type python dot2tex to invoke the program.
2.2. Command line options
The following options are available:
| -h, --help | Display help message. |
| -f fmt, --format fmt | |
Set output format. The following values of fmt are supported:
| |
| -t mode, --texmode mode | |
Text mode. Specify how text is converted.
Note that you can locally override the text mode by assigning a special | |
| -s, --straightedges | |
Draw edges using straight lines. Graphviz uses bezier curves to draw straight edges. Use this option to force the use of line to operations instead of curves. Does not work in duplicate mode. | |
| -o filename, --output filename | |
| Write output to file. | |
| -d, --duplicate | |
| Duplicate the xdot output. Uses the drawing information embedded in the xdot output to draw nodes and edges. | |
| --template filename | |
| Use template from file. See the Templates section for more details. | |
| -V, --version | Print version information and exit. |
| -w, --switchdraworder | |
| Switch drawing order of nodes and edges. By default edges are drawn before nodes. | |
| -c, --crop | Use preview.sty to crop the graph. Currently only implemented for the pgf and tikz output format. |
| --figonly | Output the graph without a document preamble. Useful if the graph is to be included in a master document. |
| --codeonly | Output only the drawing commands, without wrapping it in a tikzpicture or pspicture environment. Useful when used with the dot2texi package. |
| --preproc | Preprocess the graph through LaTeX using the preview package. Will generate a new dot file where the height and widths of nodes and edge labels are set based on the results from preview. |
| --autosize | Preprocess the graph and run Graphviz on the output. Equivalent to: $ dot2tex --preproc ex1.dot | dot2tex
|
| --prog program | Set graph layout program to use when the input is in plain dot format. Allowed values:
|
| --progoptions options | |
| Pass options to graph layout program. | |
| --usepdflatex | Use pdflatex instead of latex for preprocessing the graph. |
| --nominsize | Ignore minimum node sizes during preprocessing. |
| --valignmode mode | |
Vertical alignment of node labels, where
( | |
| --alignstr | Used to pass a default alignment string to the PSTricks \rput[alignstr] ...
Only works for the PSTricks format. PGF/TikZ users can instead pass an |
| --tikzedgelabels | |
Bypass Graphviz’ edge label placement and use PGF/TikZ instead (tikz and pgf formats only). | |
| --styleonly | Use TikZ only styles when drawing nodes. No draw or shape option is added (tikz format only). |
| --nodeoptions tikzoptions | |
Wrap node code in a scope environment with tikzoptions as parameter (tikz format only). | |
| --edgeoptions tikzoptions | |
Wrap edge code in a scope environment with tikzoptions as parameter (tikz format only). | |
| --debug | Write detailed debug information to the file dot2tex.log in the current directory. |
| --pgf118 | Generate code compatible with PGF 1.18 and earlier. |
| --pgf210 | Generate code compatible with PGF 2.10. |
The following options are used by the output templates.
| -e encoding, --encoding encoding | |
Set text encoding. Supported encodings are:
| |
| --docpreamble TeXcode | |
| Insert TeX code in the document preamble. | |
| --figpreamble TeXcode | |
| Insert TeX code in the figure preamble. | |
| --figpostamble TeXcode | |
| Insert TeX code in the figure postamble. | |
| --graphstyle style | |
Sets the <<graphstyle>> tag. | |
| --margin margin | |
Set margin around the graph when using preview.sty. margin must be a valid TeX unit. By default margin is set to 0pt. | |
2.3. Output formats
The output format is specified with the -f fmt or --format fmt command line option. The following output formats
are available form the command line. Additionally there is a special positions output format only available when
using dot2tex as Python module.
2.3.1. PGF
This is the default output format. Generates code for the Portable Graphics Format (PGF) package . Mixes both PGF and TikZ commands.
2.3.3. TikZ
The tikz output format also uses the PGF and TikZ package. However, it relies on TikZ node and edge mechanisms to draw nodes and edges, instead of using the drawing information provided by Graphviz. This allows much tighter integration with TikZ and in some cases prettier results.
Advantages of the tikz format:
- The generated code is very compact and clean.
- Easy to modify the output.
- Labels will fit inside nodes without preprocessing.
- Full access to the power of PGF and TikZ.
You can find more details in the section: Use the tikz output format for maximum flexibility.
Note
The tikz output format requires detailed knowledge of the PGF and TikZ package. Some of Graphviz’ features will not work with this output format.
2.4. Labels
The main purpose of dot2tex is to allow text and labels to be typeset by LaTeX. Labels are treated differently according to the current TeX mode:
verbatim- Text is displayed with all special TeX chars escaped (default).
math- Output all text in math mode $$.
raw- Output text without any processing.
The TeX mode can be set on the command line using the -t option. It can also be set locally in a graph by using the special texmode attribute.
You can also use the special texlbl attribute on a graph element, which is interpreted as raw TeX string. If a texlbl attribute is found, it will be used regardless of the current TeX mode. It also has precedence over the label attribute.
Note
The \ character needs to be escaped with \\ if used in the label attribute.
Note that only position and alignment information is converted. Any font information is lost. This may result in some odd behavior. Some tweaking may be necessary to get it right. See the section Vertical label alignment for tips.
Note
If you use texlbl for edges, you have to provide a dummy label attribute. Otherwise Graphviz will not generate the necessary code for placing edge labels.
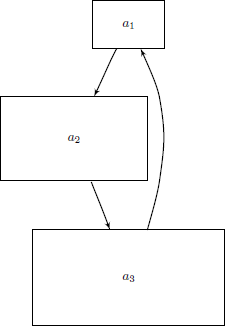
2.4.1. Label examples
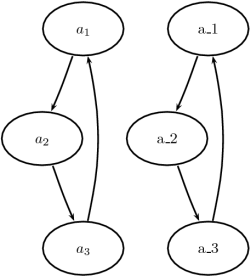
Consider the following graph:
digraph G {
    a_1-> a_2 -> a_3 -> a_1;
}
Converting the graph using:
$ dot2tex -tmath ex1.dot > ex1.tex
gives the result shown in the left hand side of the figure below. The default rendering is shown to the right. Using the raw mode will result in a compilation error because of the underscore character.
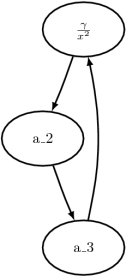
Example of using texlbl:
digraph G {
    a_1 [texlbl="$\frac{\gamma}{x^2}$"];
    a_1-> a_2 -> a_3 -> a_1;
}
Example of using the texmode attribute:
digraph G {
    a_1 [texlbl="$\frac{\gamma}{2x^2+y^3}$"];
    a_1 -> a_2 -> a_3 -> a_1
    node [texmode="math"];
    a_1 -> b_1 -> b_2 -> a_3;
    b_1 [label="\\frac{\\gamma}{x^2}"];
    node [texmode="verbatim"]
    b_4 [label="\\beta"]
    a_3 -> b_4 -> a_1;
}
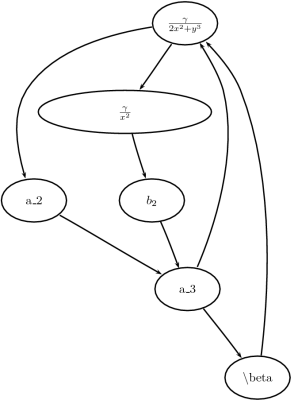
The above example shows two important things:
- The backslash
\character needs to be written as\\in thelabelattribute. - Using LaTeX markup in the
labelattribute gives oversized nodes. A workaround is to use thetexlblattribute, and manually pad thelabelattribute to an appropriate length. A much better solution is to use the--preprocoption.
Preprocessing the above graph with:
$ dot2tex --preproc ex4.dot | dot2tex > ex4.tex
gives correctly sized nodes:
Read more about preprocessing in the Preprocessing graphs section.
2.4.2. Vertical label alignment
Dot2tex relies on the xdot format for drawing nodes and placing node labels. The fonts that Graphviz and LaTeX use are different, so using the label coordinates from Graphviz does not always give good results. Dot2tex’s default behavior is to place node labels in the middle of the node. However, you can change this behavior by setting the valignmode option to dot. Labels will then be placed using the coordinates supplied by Graphviz.
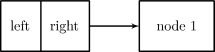
Here is an example graph where it is necessary to use the valignmode option:
digraph G {
    node0 [label="{left|right}", shape=record];
    node1 [shape=rectangle, label="node 1"];
    node0 -> node1;
    rankdir=LR;
}
For record nodes dot2tex has to use Graphviz coordinates. This is shown in the following figure rendered with:
$ dot2tex valign.dot
To get the same vertical alignment for both nodes, you can use:
$ dot2tex --valignmode=dot valign.dot
Now the labels are aligned, but the labels are still placed too low. The reason for this is that both PSTricks and PGF by default centers text vertically on the current coordinate. The alignment point should in this case be set to the baseline. For PGF/TikZ you can use the --graphstyle option like this:
$ dot2tex --valignmode=dot --graphstyle="anchor=base" valign.dot
PSTricks users have to use the --alingstr option:
$ dot2tex --valignmode=dot --alignstr=B valign.dot
The result is better, but to get even better alignment you have to change the node font size. Graphviz’ default font size is 14pt, which is larger than the typical 10pt or 11pt used in LaTeX documents. By changing the node font size to 10pt we can trick Graphviz to give us a better alignment:
digraph G {
    node [fontsize=10];
    node0 [label="{left|right}", shape=record];
    node1 [shape=rectangle, label="node 1"];
    node0 -> node1;
    rankdir=LR;
}
2.5. Preprocessing graphs
A problem with using LaTeX for typesetting node and edge labels, is that Graphviz does not know the sizes of the resulting labels. To circumvent this problem, you can use the --preproc or --autosize option. The following will then happen:
- Node and edge labels are extracted and the corresponding LaTeX markup is saved to a temporary file.
- The file is typeset with LaTeX and information about sizes is extracted using the preview package.
- A new dot file is created where node and edge label sizes are set using the dot language’s
widthandheightattributes. - The generated graph can now be processed using Graphviz and dot2tex. Label sizes will now correspond with the output from LaTeX.
Widths and heights of nodes are handled the in same way as Graphviz does it. The width and height attributes set the minimum size of the node. If label size + margins is larger that the minimum size, the node size will grow accordingly. Default values are width=0.75in and height=0.5in.
Node margins are set using the margin attribute. This also works for edge labels. margin==value sets both the horizontal and vertical margin to value, margin=="hvalue,vvalue" sets the horizontal and vertical margins respectively.
Note
All sizes are given in inches.
If you do not want a minimum node size, you can use the ‘–nominsize’ option. Dot2tex will then use size of label + margins as node size.
Nodes with fixedsize=True attributes are not processed.
Limitations:
- Does not work for HTML-labels
- Does not work for record-based nodes
2.5.1. Examples
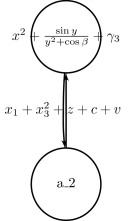
Consider the following graph:
digraph G {
    node [shape=circle];
    a_1 [texlbl="$x^2+\frac{\sin y}{y^2+\cos \beta}+\gamma_3$"];
    a_1 -> a_2 [label=" ", texlbl="$x_1+x_3^2+z+c+v~~$"];
    a_2 -> a_1;
}
Rendered with:
$ dot2tex -tmath example.dot > example.tex
the graph will look like this:
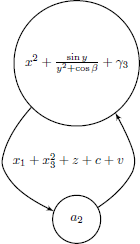
You could improve the result by adding a longer label attribute or setting a fixed width. A better solution is to preprocess the graph like this:
$ dot2tex -tmath --preproc example.dot > exampletmp.dot
$ dot2tex exampletmp.dot > example.tex
You can also chain the commands:
$ dot2tex -tmath --preproc example.dot | dot2tex > example.tex
A shorter alternative is:
$ dot2tex -tmath --autosize example.dot > example.tex
The resulting graph now has correctly sized nodes and edge labels:
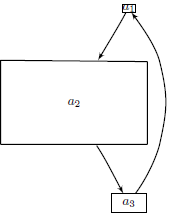
Modifying node sizes using the widht/height and margin attributes can be a bit counterintuitive. A few examples will hopefully make it clearer:
digraph G {
    node [shape=rectangle];
    a_1 [margin="0"];
    a_2 [margin="0.7,0.4"];
    a_3 [width="2",height="1"];
    a_1-> a_2 -> a_3 -> a_1;
}
Processing the graph with:
$ dot2tex -tmath --preproc example.dot | dot2tex > example.tex
gives
Setting the margin of a_1 to 0 has no effect because of the minimum node width. Processing the graph with:
$ dot2tex -tmath --preproc --nominsize example.dot | dot2tex > example.tex
gives a different graph, where only label widths and margins affect the node sizes: